
“You’re trying to steal my house!” is a common reaction when Long Island homeowners receive cash offers 10–20% below retail value. The emotional response is understandable — your home represents years of equity, memories, and financial security. But the question of whether cash buyers pay fair prices requires moving beyond emotion to examine actual data, market realities, and the specific value proposition cash buyers provide.
In 2026, Nassau and Suffolk County sellers evaluating cash offers need objective frameworks to distinguish between fair offers reflecting genuine business economics and lowball offers exploiting seller desperation. The answer isn’t simple — what constitutes “fair” depends on property condition, seller timeline, market conditions, and the certainty value you place on guaranteed closing versus potential higher prices with significant uncertainty.
This article examines real market data, breaks down how legitimate investors calculate offers, compares net proceeds across different selling methods, and provides tools to evaluate whether specific cash offers represent fair value for your unique circumstances. The goal isn’t to convince you cash sales are always best — it’s to help you make informed decisions based on facts rather than assumptions.
Fair Price Reality Check
$500K Long Island Home – Net Proceeds Comparison
Traditional Sale
Cash Sale
Cash offer nets $1K MORE than traditional sale despite 19% lower price. Closes 6 months faster with zero risk.
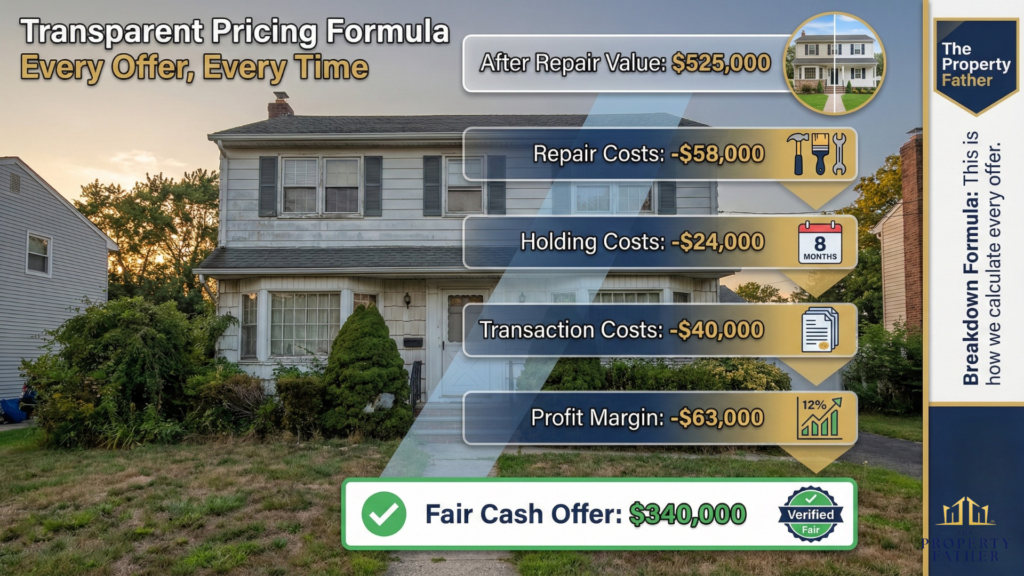
How Fair Offers Are Calculated
– Repair Costs
– Holding Costs
– Transaction Costs
– Profit (10-15%)
= Fair Cash Offer
Understanding “Fair” in Real Estate Context
Before examining data, we need to establish what “fair” actually means in real estate transactions.
Fair Doesn’t Mean Retail
A fundamental misunderstanding causes most confusion about cash buyer pricing: fair doesn’t mean retail market value. Retail prices reflect what end-user buyers pay for move-in ready homes through traditional financing. Cash buyers purchasing as-is properties for renovation aren’t end users — they’re business operators making investments requiring positive returns.
Fair pricing in a real estate investment context reflects the property’s actual condition, required improvements, transaction costs, holding periods, and reasonable profit margins for the business risk involved. This is a standard principle of real estate appraisal and investment analysis, not a subjective claim.
Multiple “Fair” Valuations Exist
Your Long Island property has different values depending on how it’s sold:
Retail value: What updated, move-in ready homes sell for in traditional sales. As-is value: What homes needing repairs sell for to traditional buyers willing to renovate. Investor value: What professionals pay considering renovation costs, holding periods, and profit requirements. Distressed value: What properties sell for under time pressure or difficult circumstances.
All these represent “fair” values in different contexts. The question isn’t whether cash offers match retail — they won’t. The question is whether they fairly reflect as-is or investor value given your property’s actual condition and your situation.
The Certainty Premium
Traditional sales offering potentially higher prices come with significant uncertainty. According to Redfin’s 2024–2025 MLS analysis, approximately 14–16% of pending home-purchase contracts are canceled nationally. Full terminations account for roughly 6% of transactions, while an additional 14% face delays, per NAR data. Notably, Nassau County consistently records one of the lowest cancellation rates in the country — approximately 4–5% of pending contracts — giving Long Island sellers somewhat better odds than the national average. Still, no financed transaction is certain until closing.
Cash offers trade maximum price for certainty. Because cash buyers carry no financing contingency, their transactions carry a near-certain close probability once a contract is executed. This reliability has real value — quantifiable value many sellers prefer over uncertain higher offers.
Advisory Note: Contract cancellation rates vary by market, season, price point, and economic conditions. The figures above are national averages. Consult a local real estate professional for current Long Island-specific data.
What the Data Actually Shows
Real market data reveals how cash offers compare to traditional sales and whether the difference represents fair business economics or exploitation.
National Cash Sale Data
Industry research and investor activity reports generally indicate the following discount ranges for cash offers on as-is properties, though specific figures vary by market, condition, and year. Consult current data from ATTOM Data for the most recent verified figures:
- Average cash offer discount: approximately 12–18% below retail comparable sales
- Typical range: 10–25% depending on property condition and local market
- Properties needing significant repairs: 15–30% below retail
- Turnkey properties: 8–12% below retail
These discounts aren’t arbitrary — they reflect documented costs that investors must cover to make business operations viable.
Advisory Note: These ranges are illustrative, based on commonly cited industry estimates. They are not verified against a single primary study. For sourced data, refer to ATTOM Data’s investor purchase reports or NAR’s Realtors Confidence Index for current cash buyer activity metrics.
Long Island Specific Data
Nassau and Suffolk County markets follow similar patterns with regional variations. Long Island-specific figures should be verified against current OneKey MLS data or ATTOM Data reports. The following ranges are broadly consistent with national patterns for the region but should not be treated as confirmed local benchmarks without primary source verification:
- Properties needing renovation in Suffolk County: approximately 14–20% below retail
- Nassau County for similar properties: approximately 12–18% below retail
- Condition-dependent variation: poor condition (20–30% discount) vs. good condition (10–15% discount)
Advisory Note: Long Island property market data changes seasonally and year over year. Verify current discount ranges with a licensed local real estate professional or OneKey MLS data before using these figures in financial planning.
Net Proceeds Comparison
The critical question isn’t gross sale price — it’s net proceeds after all costs. Real data shows surprising results.
Example: $500,000 Long Island home needing $40,000 repairs
Traditional sale:
- Retail price: $490,000 (after 2–3% condition discount)
- Listing agent commission (post-NAR settlement, typically 2–3%): approximately -$12,250–$14,700
- Buyer agent compensation (now separately negotiated; seller may or may not contribute): -$0 to -$12,250
- Pre-listing repairs: -$40,000
- Carrying costs (approximately 2–3 months to contract + 45 days to close): -$12,000–$15,000
- Staging, photos: -$2,500
- Inspection credits: -$8,000
- Net proceeds: approximately $390,000–$415,000 (range reflects commission structure variability)
- Timeline: approximately 2–3 months
Cash sale:
- Offer: $395,000 (approximately 19% below retail)
- Commission: $0
- Repairs: $0
- Carrying costs (2 weeks): -$1,200
- Net proceeds: approximately $393,800
- Timeline: 7–14 days
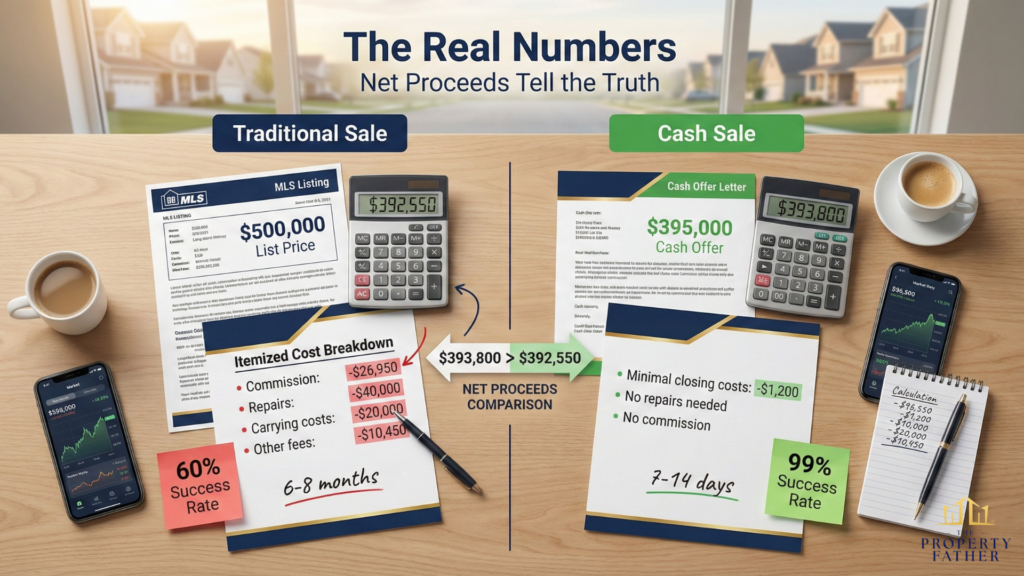
In this example, depending on how post-NAR settlement commissions are structured, the cash offer may net comparable to or more than a traditional sale while closing months faster with substantially less uncertainty.
Advisory Note: Net proceeds calculations are illustrative only. Actual results depend on your property’s condition, negotiated sale price, commission arrangements (which are now fully negotiable under the August 2024 NAR settlement), carrying costs specific to your mortgage, and closing costs including New York State transfer tax (0.4% of sale price, typically paid by the seller under NY Tax Law §1402). Consult a licensed real estate attorney before making any decisions based on these figures.
Understanding the true cost of selling with a realtor reveals why net proceeds often favor cash sales for properties needing significant work, despite lower gross prices.
How Cash Buyers Calculate Offers
Transparency about calculation methodology helps evaluate fairness.
The Standard Formula
Legitimate cash buyers use this industry-standard calculation:
Purchase price = ARV − Repair costs − Holding costs − Transaction costs − Profit margin
Where:
ARV (After Repair Value): What the home will sell for after renovation.
Repair costs: Documented expenses to renovate.
Holding costs: Mortgage, taxes, insurance, and utilities during renovation and resale (typically 6–12 months for a full renovation project).
Transaction costs: Buying costs + selling costs (commission, closing fees, etc.).
Profit margin: Reasonable return for business risk. The 10–15% of ARV figure is a widely cited benchmark in real estate investment analysis, though actual margins vary by operator, market, and project.
Understanding how we buy houses companies work can help you assess whether the calculations you receive are realistic.
Real Long Island Example
Huntington property requiring updates:
- ARV (retail value after repairs): $525,000
- Kitchen renovation: -$25,000
- Bathroom updates: -$12,000
- Flooring throughout: -$10,000
- Paint and cosmetics: -$8,000
- HVAC service/repair: -$3,000 → Total repairs: -$58,000
- Holding costs (8 months renovation + sale): -$24,000
- Purchase transaction costs: -$8,000
- Sale transaction costs (listing commission, staging): -$32,000 → Total holding + transaction: -$64,000
- Profit (approximately 12% of ARV): -$63,000
Calculated offer: $525,000 − $58,000 − $64,000 − $63,000 = $340,000
This represents a significant discount from retail, but it reflects documented costs and a standard profit margin. The offer is “fair” given the actual work, risk, and capital required.
Sellers can verify these calculations by getting contractor estimates for repairs, researching comparable sales for ARV, and understanding why investor profit requirements make sustainable operations possible.
When Offers Aren’t Fair
Multiple variables influence what constitutes a fair cash offer.
Property Condition
Condition dramatically impacts fair offer ranges:
Excellent condition (turnkey ready): Fair cash offer: 85–92% of retail. Minor discounts reflect only transaction efficiency.
Good condition (minor updates needed): Fair cash offer: 75–85% of retail. Discounts cover cosmetic improvements and standard profit.
Fair condition (major systems aging): Fair cash offer: 65–75% of retail. Discounts address HVAC, roof, or other significant expenses.
Poor condition (structural or major issues): Fair cash offer: 50–65% of retail. Large discounts reflect foundation, electrical, or plumbing overhauls.
A $500,000 retail home in poor condition fairly priced at $300,000 (40% discount) might reflect $120,000 in repairs, $50,000 in costs, and $30,000 profit — legitimate business economics, not exploitation.
Market Conditions
Local market strength affects fair pricing:
- Strong seller’s market: Cash offers may approach 80–90% of retail as investors compete for inventory.
- Balanced market: Cash offers typically range 70–80% of retail.
- Buyer’s market: Cash offers may drop to 60–70% of retail as investor risk increases.
Market conditions for Long Island shift seasonally and year to year. Verify current conditions with FHFA House Price Index data or local MLS reports.
Seller Timeline
Urgency affects what’s “fair” given your circumstances:
- No timeline pressure: You can shop multiple offers, negotiate, and optimize pricing.
- Moderate pressure (60–90 days): Fair offers reflect normal investor economics.
- Urgent timeline (under 30 days): Some speed premium may apply, but shouldn’t be extreme.
- Crisis situation (foreclosure): Speed matters, but protection from predatory operators matters more.
Legitimate investors don’t dramatically exploit urgency, but fair pricing acknowledges compressed timelines affect leverage.
Property Size and Price Range
Lower-priced homes ($200–300K): Often see larger percentage discounts (20–30%) because fixed costs (permits, inspections) represent a larger share of the investment.
Mid-range homes ($400–600K): Typically see 12–20% discounts with standard profit margins.
Higher-end homes ($700K+): May see smaller percentage discounts (10–15%) but larger absolute dollar gaps.
A 25% discount on a $250,000 home might fairly reflect business economics, while the same percentage on a $750,000 property could indicate unfair pricing.
Comparing Cash Offers to Alternatives
Fair pricing requires comparing cash offers to realistic alternatives, not idealized best-case scenarios.
Cash vs. Traditional Listing
The comparison most sellers make — but often incorrectly:
- What sellers assume: Cash offer vs. retail list price.
- Reality: Cash offer vs. net proceeds after repairs, commissions, carrying costs, and risk.
When properly calculated, fair cash offers often deliver net proceeds comparable to traditional sales for properties needing significant work, while eliminating months of uncertainty. See the comparison between selling to an investor vs. listing with an agent for a detailed breakdown.
Cash vs. FSBO
Some sellers consider selling For Sale By Owner to save commission costs. However, according to the NAR 2025 Profile of Home Buyers and Sellers, the median FSBO sale price was $360,000 versus $425,000 for agent-assisted homes — an 18% gap in favor of listed homes. FSBO transactions also hit a record low of just 5% of all home sales in 2025.
The data suggests that while sellers avoid listing commissions with FSBO, they typically give back more in sale price, while still facing carrying costs, inspection issues, and deal uncertainty.
Advisory Note: NAR’s FSBO vs. agent-assisted price comparison reflects national medians and includes a mix of property types. The gap may reflect that FSBO sellers tend to own lower-priced properties in rural areas, which could account for part of the disparity. Consult a local real estate professional for a market-specific assessment.
Cash vs. iBuyers (Opendoor, etc.)
Tech-enabled iBuyers offer convenience but at costs:
- iBuyer service fees: Typically 5–7% plus repair deductions.
- Pricing: Often comparable to local investors after fees.
- Limitations: As of early 2026, most major iBuyers do not actively operate in Nassau or Suffolk County — verify current availability before considering this option.
Where available, iBuyer net proceeds often align closely with local investor offers, suggesting market pricing reflects fair economics rather than exploitation.
Cash vs. Auction
Sellers facing urgent timelines sometimes consider auctions:
- Auction pricing: Typically 60–75% of retail.
- Speed: Fast but uncertain final price.
- Fees: Buyer’s premiums of 10–15% can reduce effective seller proceeds.
Auctions generally net less than investor offers, confirming that cash buyers offer competitive pricing relative to other rapid-sale methods.
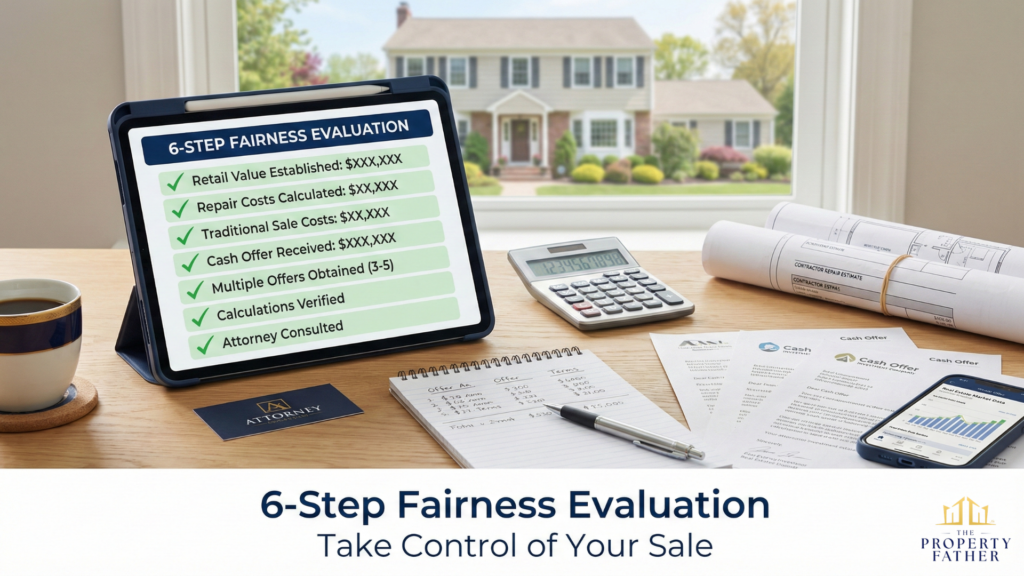
How to Evaluate If YOUR Offer Is Fair
Use this framework to assess specific offers you receive.
Step 1: Establish Your Property’s Retail Value
Research comparable sales: find 5–8 truly comparable homes (similar size, age, location, condition), adjust for condition differences, and calculate a realistic retail range for your home in its current state.
Use Zillow, Realtor.com, and recent sales data as a starting point, but verify with OneKey MLS or a licensed Long Island agent for the most accurate local figures.
Step 2: Calculate Needed Repairs
Get contractor estimates: obtain 2–3 quotes for major items (roof, HVAC, foundation), use industry cost guides for cosmetic improvements, include permits and code compliance costs, and add a 10–15% contingency for unexpected issues.
Step 3: Estimate Traditional Sale Costs
Calculate what a traditional listing would actually net:
- Retail value minus condition discount (2–5%)
- Listing agent commission (typically 2–3% post-NAR settlement; buyer agent compensation now separately negotiated)
- Pre-listing repairs: your contractor estimates
- Carrying costs: approximately $3,000–$6,000/month × your estimated months to close
- Staging and photos: $2,000–$4,000
- Inspection credits: $5,000–$10,000 average
- Uncertainty factor: ~14–16% national contract cancellation rate
Advisory Note: Commission costs are now fully negotiable under the August 2024 NAR settlement. The listing agent commission and buyer agent compensation are separate and independently negotiated. Do not assume a combined 5–6% is the standard. Confirm current commission expectations with a licensed agent before calculating net proceeds.
Step 4: Compare Cash Offer to Traditional Net
A fair cash offer should be:
- Within 5–10% of your estimated traditional sale net proceeds, or
- Higher than traditional net when factoring in timeline value and certainty
If cash offer significantly exceeds traditional net — it’s not just fair, it’s excellent. If cash offer is within 10% of traditional net — it’s fair given speed and certainty benefits. And if cash offer is 20%+ below traditional net — request explanation or seek competing offers.
Step 5: Verify Investor Calculations
Ask cash buyers to show comparable sales used for ARV, repair cost estimates (verify against your contractor quotes), holding cost calculations, and their profit margin percentage. Legitimate buyers willingly explain their math. Refusal to show calculations is a red flag.
Step 6: Get Multiple Offers
Contact 3–5 cash buyers. Compare offer amounts, explanation quality, transparency, and professionalism. Use the highest offer as leverage with others. Fair market pricing means multiple legitimate buyers cluster within 5–10% of each other. Outliers in either direction warrant scrutiny.
Real Long Island Examples: Fair or Unfair?
Example 1: Nassau County Estate Sale
Property: $480,000 retail value, needs $35,000 updates. Cash offer: $360,000 (25% discount). Seller situation: Inherited property, three heirs, out of state.
Evaluation:
- Retail after condition discount: $465,000
- Needed repairs: -$35,000
- Listing commission (approx. 2–3% post-settlement): ~$11,625–$13,950
- Buyer compensation (variable post-settlement): $0–$11,625
- Carrying costs (5 months): -$18,000
- Staging: -$2,000
- Estimated traditional net: approximately $383,000–$398,000
Cash offer net: $360,000 minus ~$2,000 closing costs = approximately $358,000
The cash offer nets approximately $25,000–$40,000 less than a traditional sale. However: it closes in 10 days vs. 2–3 months; eliminates repair coordination across three states; guarantees closing with no deal fallthrough risk; and eliminates ongoing estate carrying costs.
Verdict: Fair offer given circumstances. Speed and certainty value justifies the modest gap for out-of-state heirs needing a clean resolution.
Example 2: Suffolk County Foreclosure
Property: $425,000 retail value, needs $20,000 repairs. Cash offer: $275,000 (35% discount). Seller situation: 60 days to foreclosure auction.
Evaluation:
Given New York’s judicial foreclosure process, a 60-day window is extremely tight. Traditional listing is not viable within this timeline. The realistic comparison is against a foreclosure auction, which typically yields 60–75% of retail ($255,000–$320,000 in this case), with buyer’s premiums of 10–15% further reducing effective proceeds.
Cash offer at $275,000 falls at the lower end of the auction range.
Verdict: This offer could reasonably be pushed to $300,000–$320,000 even given urgency. The 35% discount exceeds what the legitimate business economics require for a property needing only $20,000 in repairs. The seller should seek at least one competing cash offer before accepting.
Example 3: Huntington Divorce Sale
Property: $550,000 retail value, needs $45,000 updates. Cash offer: $420,000 (24% discount). Seller situation: Divorce settlement, need equity split quickly.
Evaluation:
- Retail: $550,000
- Needed repairs: -$45,000
- Listing commission (approx. 2–3%): ~$13,750–$16,500
- Buyer compensation (variable): $0–$13,750
- Carrying costs (approximately 2–3 months to contract + 45 days to close): ~$15,000–$22,000
- Inspection credits: -$8,000
- Estimated traditional net: approximately $435,000–$458,000
Cash offer net: $420,000 minus ~$2,500 closing costs = approximately $417,500
The gap between cash and traditional net is approximately $17,500–$40,500 depending on commission structure. Benefits: closes in 2 weeks vs. 2–3+ months; no ongoing conflict about repairs or staging; immediate equity split; certainty versus potential deal collapse.
Verdict: Fair offer. The financial gap is modest relative to the emotional and logistical burden of managing a contested marital property sale over several months.
Common Misconceptions About Fair Pricing
Myth 1: “Cash Buyers Are All Scammers Lowballing”
Most legitimate cash buyers operate with standard profit margins and transparent calculations. Scammers exist — but so do thousands of professional investors providing valuable services. The solution isn’t avoiding all cash buyers; it’s verifying calculations, getting competing offers, and working with a real estate attorney.
Myth 2: “I Should Get Retail Price Even As-Is”
Properties needing $50,000 in repairs don’t command retail prices from any buyer type. Traditional buyers either walk away, demand repair credits, or offer less. Investors at least buy regardless of condition — the question is whether their pricing is fair given documented costs.
Myth 3: “All Offers Below Retail Are Unfair”
Context is everything. A 20% discount might be very fair for a property needing extensive work, or significantly low for a turnkey home. Fair pricing reflects condition, market, and alternatives — not retail comparisons alone.
Myth 4: “Investors Make Too Much Profit”
A 10–15% profit margin of ARV is a commonly cited benchmark in real estate investment analysis, compensating for capital risk, market fluctuations, renovation challenges, and months of carrying costs during resale. Margins below 10% make operations unsustainable for most operators. Margins above 20% warrant scrutiny.
Advisory Note: No single authoritative source publishes a universally agreed “standard” investor profit margin. The 10–15% figure is a widely referenced industry benchmark, not a regulatory standard. Verify claims about investor margins with ATTOM Data or similar primary sources.
Myth 5: “Fair Means I Walk Away Happy”
Fair means you received market-appropriate compensation given your property’s condition and circumstances. You might wish prices were higher — everyone does — but fair pricing reflects reality, not wishes.
Understanding whether selling for cash is worth it requires accepting those market realities.
When Cash Offers Aren’t Fair — And What to Do
Sometimes offers genuinely fail fairness tests. Signs of unfair offers include: refusal to explain calculation methodology; offers wildly below multiple competing bids; deep discounts not justified by documented repair costs; pressure tactics preventing comparison shopping; and no proof of ability to close.
Action Steps:
Get competing offers from 3–5 other buyers to establish the fair range. Consult a real estate attorney for professional evaluation of offer and terms. Present competing offers and ask for justification or recalculation. Walk away if the offer remains unfair and the buyer won’t negotiate reasonably. Consider traditional listing if your timeline permits and the property condition supports it.
Understanding when selling to an investor makes sense helps recognize situations where alternatives might serve you better.
The Bottom Line: Fair Is Contextual
Do cash buyers pay fair prices? Data shows legitimate investors typically do — when “fair” is properly defined as market-appropriate compensation given actual property condition and needed repairs, documented investor costs, seller timeline constraints, available alternative selling methods and their realistic net proceeds, and the certainty value of a guaranteed close.
Fair cash offers typically range 10–25% below retail depending on condition, but often deliver net proceeds within a comparable range of traditional sales after accounting for all costs — while closing in 7–14 days versus 2–3 months or more, with substantially higher certainty.
Unfair offers do exist — typically from operators who refuse to explain pricing methodology, use pressure tactics to prevent comparison shopping, offer well below multiple competing bids, lack proof of funds, or use contingent contracts. The solution isn’t avoiding all cash buyers — it’s doing the due diligence to verify fairness.
For many Long Island homeowners facing properties needing significant repairs, tight timelines, or distress situations such as foreclosure, divorce, or estate settlement, fair cash offers provide outcomes that compare favorably to traditional sales despite lower gross prices.
Ready to Sell Your Long Island Home?
Understanding whether cash buyers pay fair prices requires examining your specific situation, property condition, and alternatives—not making blanket assumptions. The Property Father operates with complete transparency, explaining every component of our offers, providing market data to support valuations, and encouraging you to shop competing offers.
Get a fair, no-obligation offer in 24 hours. We’ll walk through our calculation, show comparable sales, explain repair estimates, and give you time to evaluate whether our offer represents fair value for your circumstances.
See our Long Island Home Selling Guide for a complete breakdown of your options.