
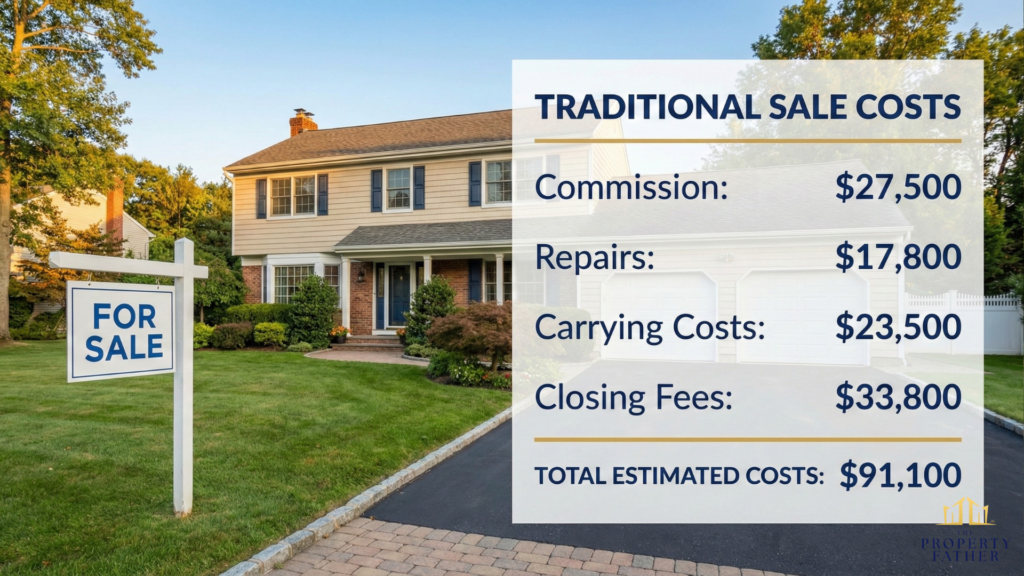
When most Long Island homeowners think about selling with a realtor, they focus on the commission. But the true cost of selling with a realtor extends far beyond that single line item. Between hidden fees, pre-listing repairs, carrying costs during extended marketing periods, and the opportunity cost of your time, the actual expense of traditional sales often exceeds expectations by $20,000–$40,000.
Understanding these complete costs doesn’t mean realtors provide no value — experienced agents offer expertise, market access, and negotiation skills that benefit many sellers. But in 2026, Nassau and Suffolk County homeowners deserve transparency about what they’re actually paying for and whether a cash buyer vs. realtor comparison might reveal a better fit for their specific situation. This comprehensive breakdown reveals every dollar you’ll spend in a traditional sale, helping you determine if listing makes financial sense for your property and circumstances.
Advisory Note: All cost figures in this article are illustrative estimates based on a hypothetical $500,000 Long Island home. Actual costs will vary based on your specific mortgage balance, property tax obligations, repair scope, agent fees, and market conditions. These figures are not a guarantee of any specific outcome.
True Cost Analysis
$500K Long Island Home Traditional Sale
Complete Cost Breakdown
18.2% total cost — Most sellers expect 5.5% but actual costs are 3x higher
The Commission: Your Largest Single Expense
Real estate commission represents the most significant cost in traditional sales, but understanding how it works in 2026 reveals important nuances.
How Commission Actually Works
Commission isn’t a fixed legal requirement — it’s negotiable, and the landscape changed significantly following the August 2024 NAR settlement. As of August 17, 2024, sellers are no longer automatically responsible for paying buyer agent compensation. Buyer agent fees are now negotiated separately between buyers and their agents, and sellers can no longer advertise commission offers through the MLS. Total compensation structures vary by transaction and what the seller chooses to offer.
On a $500,000 Long Island home using an illustrative total commission of 5.5%:
- 5.5% commission = $27,500
- What portion goes to a buyer’s agent, if anything, is now negotiated separately between the buyer and their agent
- Your listing agent’s brokerage takes a cut (typically 30–50% of their share)
- Your agent personally receives approximately $9,000–$12,000
Important context: Commission comes directly from your proceeds at closing. You don’t pay upfront, but it reduces your net sale amount dollar-for-dollar.
Why Commission Rates Persist
Despite the 2024 NAR settlement changing how buyer agent compensation is structured, total commission costs for sellers have remained relatively stable in most markets in the period following the settlement. That said, the dynamic has shifted — buyers now negotiate directly with their own agents on compensation, and sellers have more control over what, if anything, they offer toward buyer agent costs.
Quality agents continue to provide value. Experienced Long Island real estate agents understand neighborhood microclimates, school district impacts, seasonal market trends, and pricing psychology that significantly affect sale outcomes.
Transaction complexity justifies cost. Real estate transactions involve legal documents, disclosure requirements, negotiation across multiple parties, inspection coordination, appraisal management, and closing facilitation. Agents handling these details professionally provide legitimate value.
However, not every property or situation requires full-service representation. Understanding total costs helps you determine when alternatives like discount brokers or cash buyers might make more financial sense.
Pre-Listing Costs: Getting Your Home Market-Ready
Before your property even hits the market, expect to invest $5,000–$50,000+ preparing it for traditional buyers. Deciding whether to repair before selling is one of the most consequential financial decisions you’ll make in the process.
Required Repairs and Updates
Most agents recommend sellers address issues that will appear in buyer inspections or affect marketability:
Minor repairs ($2,000–$5,000):
- Fixing leaky faucets, running toilets, dripping showerheads
- Replacing cracked outlets, non-functioning switches
- Repairing torn screens, broken window mechanisms
- Patching drywall holes, fixing squeaky doors
- Addressing trip hazards on walkways or stairs
Moderate updates ($5,000–$15,000):
- Fresh interior paint (neutral colors throughout)
- Carpet replacement or professional deep cleaning
- Kitchen cabinet painting or hardware updates
- Bathroom fixture modernization
- Landscaping improvements and curb appeal enhancement
Major improvements ($15,000–$50,000+):
- Roof repairs or replacement (if showing wear)
- HVAC service or replacement (if system is aging)
- Window replacement (if older, drafty, or damaged)
- Kitchen or bathroom renovations (for dated spaces)
- Flooring replacement throughout main living areas
Many sellers underestimate these costs. What starts as “just paint and carpet” quickly escalates to $15,000–$25,000 when agents recommend addressing every issue buyers might notice. For sellers who cannot or prefer not to fund these improvements, understanding what selling as-is means is a critical alternative to consider.
Staging and Presentation
Professional staging ($1,500–$5,000):
Industry research from staging professionals and the NAR’s Profile of Home Staging consistently shows that staged homes spend significantly less time on the market than non-staged homes — with some industry studies citing up to 73% faster sales times.
- Monthly staging rental for vacant homes: $2,000–$4,000
- Partial staging (key rooms only): $1,000–$2,000
- Staging consultation without rental: $300–$500
Photography and marketing ($500–$2,000):
- Professional photography: $300–$800
- Drone aerial shots: $200–$400
- Virtual tours or video walkthroughs: $300–$800
- Twilight photography (premium): $400–$600
- Floor plans and marketing materials: $100–$300
For a typical Long Island home, expect $2,500–$7,500 in staging and marketing costs before your first showing.
Closing Costs: What You Actually Pay at Settlement
Beyond commission, sellers pay multiple fees at closing that reduce net proceeds.
Standard Seller Closing Costs
New York State transfer tax:
New York State imposes a real estate transfer tax at a rate of $2 for each $500 of sale price (0.4%). On a $500,000 Long Island home, the NYS transfer tax equals $2,000. For Nassau and Suffolk County sales, no additional county-level transfer tax applies — that layer exists in New York City, not Long Island. For residential properties selling at $1 million or more, an additional 1% mansion tax applies (paid by the buyer unless otherwise negotiated).
Advisory Note: Transfer tax obligations are property- and jurisdiction-specific. Confirm your exact obligations with your real estate attorney before closing.
Attorney fees ($1,500–$3,000):
New York requires attorney representation for real estate transactions. Your listing attorney handles document preparation, title review, and closing coordination. Complex transactions — multiple liens, estate sales, title curative work — typically cost more. See CFPB guidance on closing costs for a general overview of what to expect.
Other typical fees ($500–$2,000):
- Title insurance policy: $0–$1,000 (sometimes buyer pays, sometimes split)
- Recording fees: $200–$400
- HOA/condo documents: $200–$500 (if applicable)
- Home warranty for buyer: $400–$600 (if negotiated)
- Overnight courier/wire transfer fees: $50–$150
Total closing costs (excluding commission): $4,000–$9,500
Buyer Concessions That Reduce Your Net
Modern negotiations often include seller concessions that don’t appear obvious until closing:
Closing cost assistance (1–3% of sale price):
- Buyers request sellers to pay their closing costs
- On a $500,000 sale: $5,000–$15,000 additional reduction
- Common in markets favoring buyers or with first-time buyers using FHA loans
Repair credits from inspection ($3,000–$15,000):
- Buyer’s inspection reveals issues requiring attention
- You either make repairs or provide credit at closing
- Average inspection repair credits commonly range from $5,000–$10,000
Appraisal gaps:
- If the appraisal comes in below contract price, you may need to reduce the sale price or negotiate a split
- According to NAR’s 2024 survey data, appraisal issues cause delays in approximately 6% of transactions and can result in price renegotiation or deal cancellation
These post-contract reductions catch sellers off-guard. A $500,000 contract can become $485,000 after inspection credits and closing cost assistance.inspection credits and closing cost assistance.
Carrying Costs During the Sale Process
Every month your property remains unsold, you’re paying significant carrying costs that erode net proceeds.
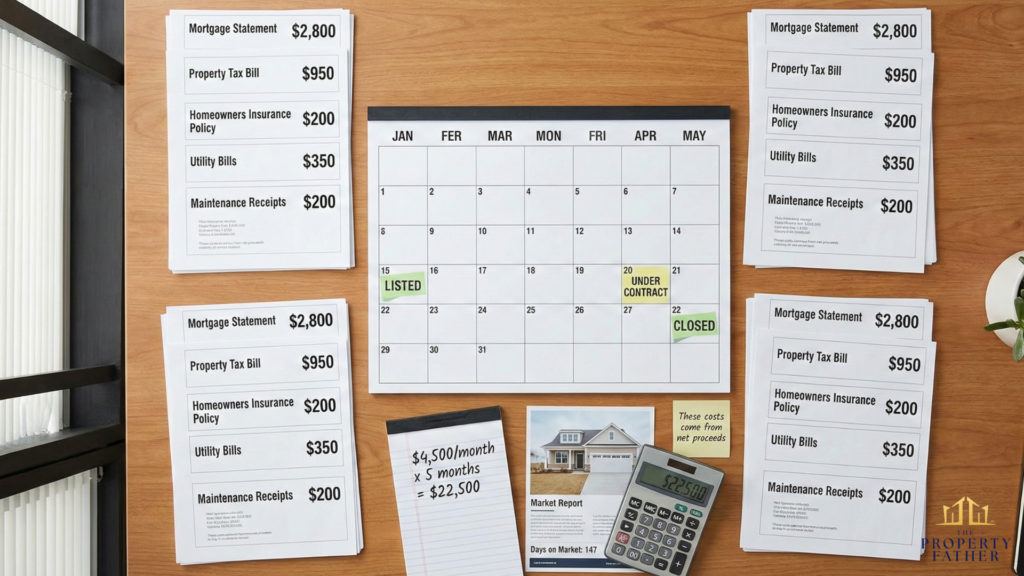
Monthly Ownership Expenses
For a typical $500,000 Long Island home:
Mortgage payment: $2,500–$3,500/month
- Depends on loan balance, interest rate, and remaining term
- Continues until closing, even if you’ve moved out
Property taxes: $900–$1,100/month
- Long Island has some of the highest property taxes nationally
- Nassau County median annual property tax bill: approximately $11,000–$12,000+
- Suffolk County varies significantly by town and school district: approximately $10,500–$12,000+ annually
- Actual bills vary considerably depending on your specific municipality and school district
Homeowners insurance: $150–$300/month
- Required until closing even if property is vacant
- Vacant home insurance typically costs more than occupied coverage
Utilities: $200–$400/month
- Electricity, gas, water, sewer must remain active for showings
- Climate control maintains showing condition and prevents damage
Maintenance and upkeep: $100–$300/month
- Lawn care, snow removal, minor repairs
- Cleaning before showings
- Keeping property show-ready
Total monthly carrying costs: $3,850–$5,600
Timeline Reality
According to current Long Island real estate market trends, time on market varies by season, condition, and pricing:
- Well-priced, excellent condition: 30–60 days
- Average condition, fair pricing: 60–120 days
- Needs work or overpriced: 120–180+ days
Add preparation time (2–4 weeks) and closing period (4–8 weeks after contract), and the total timeline runs 3–7 months from decision to close.
Carrying cost implications:
- 3 months: $11,550–$16,800
- 5 months: $19,250–$28,000
- 7 months: $26,950–$39,200
These costs come directly from your net proceeds, yet few sellers factor them into true cost calculations when deciding whether to sell with a realtor or explore alternatives.
Hidden Costs and Unexpected Expenses
Beyond obvious fees, traditional sales generate expenses sellers rarely anticipate.
Deal Fallthrough Costs
Not every home sale under contract makes it to closing. According to Redfin’s 2025 contract cancellation analysis, approximately 14–15% of pending home sales nationally fell through as of late 2025 — though Nassau County specifically has among the lowest cancellation rates in the country, under 7%, according to the same Redfin data. NAR’s 2024 survey puts the national contract cancellation rate closer to 5%. Rates vary significantly by market conditions and price point.
When a deal does fall through:
- Inspection fees ($400–$800): Already paid, non-recoverable
- Appraisal fees ($500–$700): Sometimes seller pays, money lost if deal collapses
- Time and opportunity cost: 60–90 days invested with zero results
- Carrying costs during failed transaction: $7,700–$16,800 for 2–3 months
- Starting over: New marketing, more carrying costs, potential price reduction
Maintenance and Showing Costs
Ongoing property maintenance:
- Weekly cleaning for showing-readiness: $100–$150/week
- Landscaping to maintain curb appeal: $150–$300/month
- Minor repairs from showings: $100–$300/month
Showing accommodation costs:
- Taking time off work for showing appointments
- Kenneling pets during showings: $25–$50/day
- Meals out while property shows during dinner hours
Security and vacancy issues:
- Increased insurance for vacant properties
- Security systems or monitoring
- Risk of break-ins, vandalism, or squatters in vacant properties
These smaller expenses accumulate to $2,000–$5,000+ over a typical sale period.
The Opportunity Cost of Your Time
Time represents a significant but often unquantified cost in traditional sales.
Time Investment Required
Pre-listing phase (20–40 hours):
- Researching and interviewing agents: 5–10 hours
- Coordinating repair contractors: 5–10 hours
- Decluttering, packing, preparing home: 10–20 hours
- Reviewing paperwork and listing agreements: 2–4 hours
Active listing phase (30–60 hours):
- Preparing for each showing (cleaning, leaving): 1–2 hours × 15–30 showings = 15–60 hours
- Attending open houses or vacating property: 2–4 hours × 3–5 events = 6–20 hours
- Responding to feedback and agent communications: 5–10 hours
- Home maintenance and upkeep: 2–4 hours weekly × 8–16 weeks = 16–64 hours
Contract and closing phase (15–30 hours):
- Negotiating offers and terms: 3–5 hours
- Coordinating inspection and repairs: 5–10 hours
- Managing appraisal process: 2–4 hours
- Reviewing closing documents: 2–4 hours
- Attending final walkthrough and closing: 3–6 hours
Total time investment: 65–130 hours
For working professionals valuing time at $50–$100/hour, this represents $3,250–$13,000 in opportunity cost.
For homeowners selling while managing other life challenges like divorce, job relocation, or estate settlement, this time burden creates additional stress and complications beyond monetary value.
Real Cost Analysis: Long Island Example
Let’s examine the complete true cost using a real Long Island scenario.
Case Study: $500,000 Nassau County Colonial
Let’s examine the complete true cost using a representative Long Island scenario.
Case Study: $500,000 Nassau County Colonial
Advisory Note: The figures below are illustrative estimates based on a representative scenario. Actual costs will vary based on your property’s specific condition, mortgage balance, tax obligations, negotiation outcomes, and market conditions.
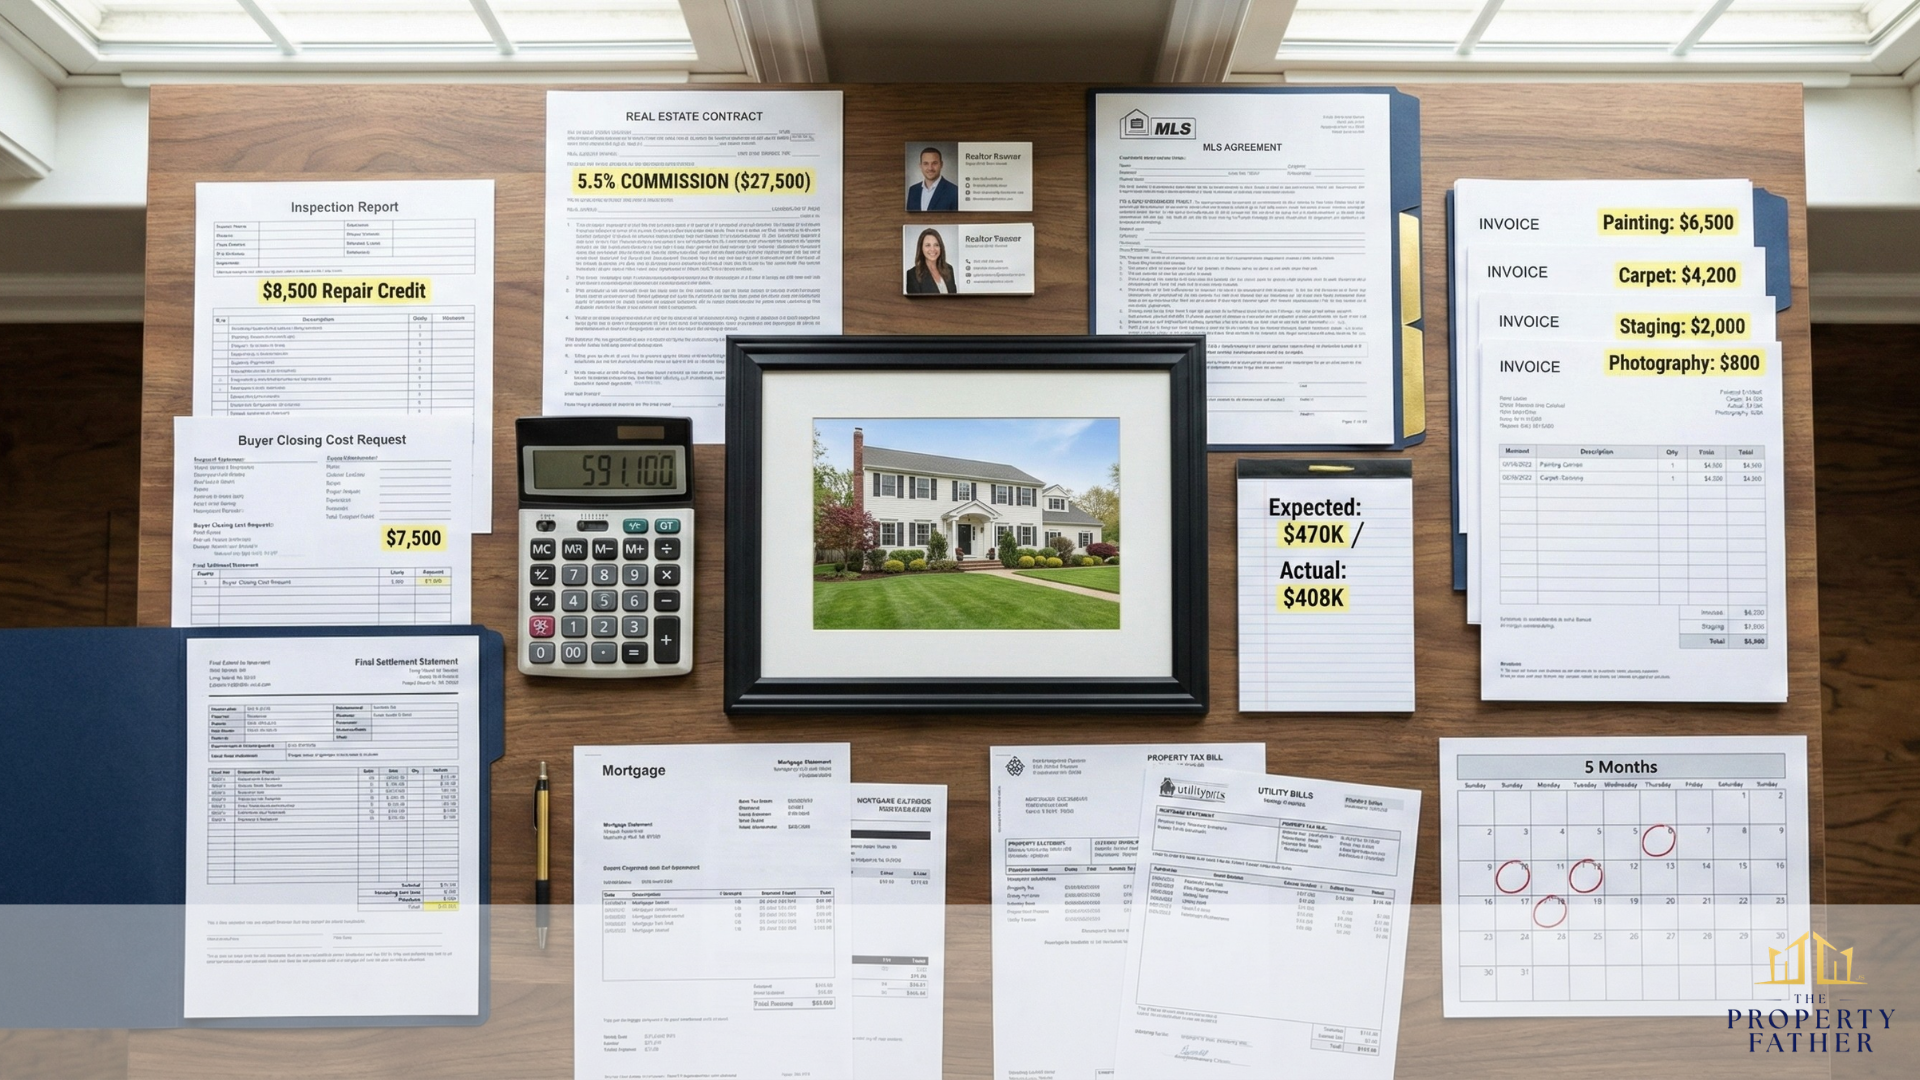
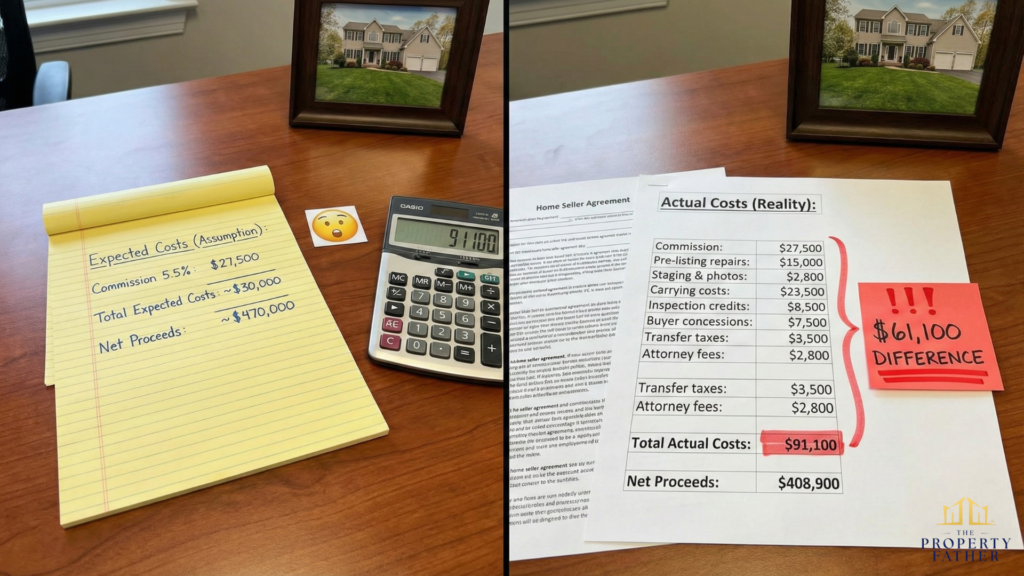
Property: Well-maintained but dated colonial needing moderate updates Initial expectations: “We’ll net about $470,000 after commission” Reality: Total costs significantly exceeded initial expectations
Commission and Fees:
- Estimated total commission (illustrative, at 5.5%): $27,500
- NYS transfer tax (0.4% of $500K): $2,000
- Attorney fees: $2,200
- Recording and misc. fees: $600
- Subtotal: $32,300
Pre-Listing Costs:
- Interior painting: $6,500
- Carpet replacement: $4,200
- Kitchen cabinet refresh: $2,800
- Landscaping improvements: $1,500
- Professional staging: $2,000
- Photography and marketing: $800
- Subtotal: $17,800
Carrying Costs (5 months):
- Mortgage payments: $15,000
- Property taxes: $5,000
- Insurance: $1,000
- Utilities: $1,500
- Maintenance: $1,000
- Subtotal: $23,500
Closing Adjustments:
- Inspection repair credit: $8,500
- Buyer’s closing cost assistance: $7,500
- Subtotal: $16,000
Total Illustrated Costs: $89,600
Sale price: $500,000 Total costs: -$89,600 Illustrated net proceeds: $410,400
Initial expectation: $470,000 Illustrated actual proceeds: $410,400 Difference: approximately $59,600 less than expected
This scenario illustrates how sellers who budget only for commission can be caught off-guard by the full picture of transaction costs. Understanding what alternatives exist helps sellers make informed choices.
When Traditional Listing Makes Financial Sense
Despite these costs, traditional listing remains the right choice in specific circumstances.
Ideal Conditions for Traditional Sales
Your property is in excellent condition:
- Move-in ready with no needed repairs
- Updated within last 10 years
- Clean inspection report expected
- Shows beautifully without major staging
You have time and financial cushion:
- Can afford 4–6 months of carrying costs comfortably
- No time pressure from job changes, foreclosure, or life events
- Emotional capacity to manage showing disruptions
The market favors sellers:
- Low inventory in your neighborhood
- Multiple offers expected on well-priced homes
- Recent comparable sales show strong buyer demand
You want to maximize sale price:
- Willing to accept uncertainty for potential higher proceeds
- Can wait for the right buyer willing to pay a premium
- Property has unique features that benefit from broad market exposure
For sellers in these situations, paying the true cost of selling with a realtor makes sense because the premium achieved justifies the investment.
Alternative Selling Methods and Their Costs
Understanding traditional costs helps you evaluate alternatives objectively.
Discount Brokers
Commission: 1–3% (saving 2–4% vs. traditional) Services reduced: Limited marketing, fewer showings, less negotiation support Best for: Homes that will sell easily in active markets
FSBO (For Sale By Owner)
Direct costs: $1,000–$3,000 (marketing, legal) Hidden costs: Negotiation disadvantage; according to NAR data, FSBO homes typically sell for less than agent-represented sales, though the gap varies by market and seller experience Time investment: Significantly higher than traditional listing Best for: Experienced sellers with real estate knowledge
Cash Buyers / Real Estate Investors
Commission: $0 Repairs needed: $0 (sold as-is) Timeline: 7–14 days Carrying costs: Minimal (2 weeks vs. 5 months) Certainty: No financing contingencies
Trade-off: Lower gross sale price (typically 10–20% below retail market value)
When this makes sense:
- Your home needs significant repairs
- You need fast closing (foreclosure, divorce, relocation)
- You want certainty of proceeds without months of uncertainty
- You lack capital for pre-listing improvements
Understanding how we buy houses companies work and whether cash buyers pay fair prices helps you determine if net proceeds might be comparable after accounting for all traditional sale costs.
Making Your Decision: A Cost Framework
Use this framework to evaluate your true costs and best path forward.
Calculate Your Specific Numbers
Step 1: Estimate commission and closing costs
- Commission (negotiate with your agent; total compensation varies post-NAR settlement)
- NYS transfer tax ($2,000 on a $500K Long Island sale; check your specific price)
- Attorney and misc fees ($2,000–$4,000)
Step 2: Calculate pre-listing investment
- Required repairs (get contractor estimates)
- Staging and presentation costs
- Marketing and photography
Then, Step 3: Project carrying costs
- Monthly expenses × expected months to sell
- Use realistic timeline (4–6 months average)
- Add 2–3 months buffer for uncertainty
Step 4: Factor closing adjustments
- Inspection credits (commonly $5,000–$10,000)
- Buyer closing cost requests (1–3%)
- Appraisal gap risk
Step 5: Value your time
- Hours required × your hourly value
- Emotional toll of showing disruptions
Lastly, Step 6: Compare alternatives
- Get a cash offer to establish a baseline
- Compare net proceeds after ALL costs
- Consider whether selling for cash is worth it for your situation
- Weigh certainty vs. potential upside
Ready to Sell Your Long Island Home?
Understanding the true cost of selling with realtor doesn’t mean avoiding agents—it means making informed decisions. For pristine homes in strong markets with patient sellers, traditional listing maximizes proceeds. But for properties needing work, sellers with time constraints, or situations where uncertainty creates problems, alternative methods might deliver better net outcomes.
If your analysis reveals that traditional sale costs exceed 20% of your sale price, or if you need guaranteed proceeds without months of uncertainty, a cash offer provides a baseline for comparison. Get a fair, no-obligation offer in 24 hours and close in as little as 7 days—no commission, no repairs, no surprises.
See our Long Island Home Selling Guide for a complete breakdown of your options.