
“Why is your offer so low?” is the first question most Long Island homeowners ask when they receive cash purchase proposals. Looking at a $380,000 offer on a home you believe is worth $500,000 triggers immediate skepticism and often anger. Understanding why cash offers are lower than retail prices requires moving past emotional reactions to examine the business economics, documented costs, and value proposition that make these transactions beneficial for both parties.
In 2026, Nassau and Suffolk County sellers evaluating cash offers deserve complete transparency about pricing methodology. The difference between retail and cash prices isn’t arbitrary — it reflects real renovation costs, holding expenses, transaction fees, and profit margins necessary for sustainable investor operations. More importantly, focusing solely on gross sale price without considering net proceeds, timeline, and certainty often leads homeowners to reject cash offers that would have delivered superior outcomes.
This article breaks down exactly why cash offers are lower, shows transparent calculation examples using real Long Island properties, and helps you determine whether accepting a lower cash offer makes more financial sense than pursuing higher traditional sale prices. The goal isn’t to convince you cash sales are always best — it’s to provide complete information for informed decision-making about your largest asset.
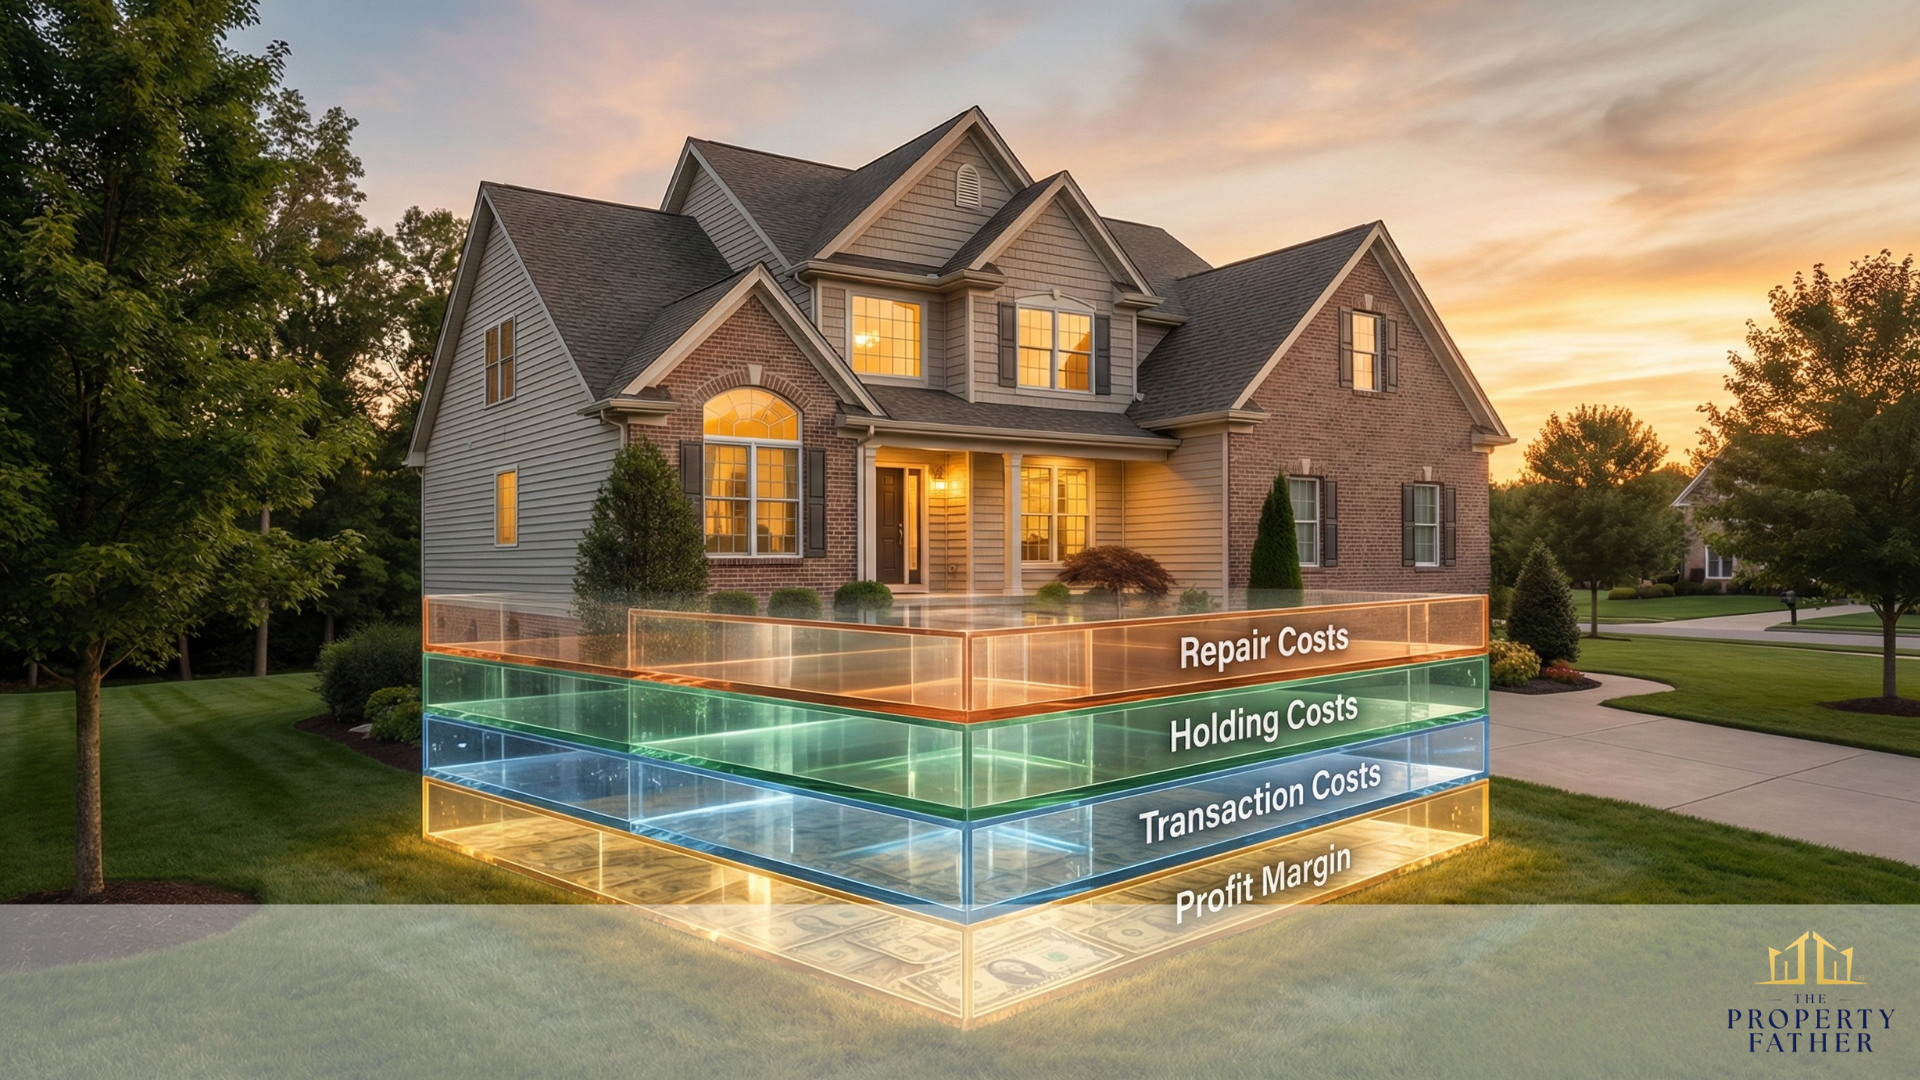
Cash Offer Breakdown
Where the Money Goes: $495K ARV Property
Why It Still Makes Sense
✓ Close in 7-14 days vs 6+ months
✓ No $35K carrying costs during sale
✓ Guaranteed closing (99% vs 60%)
✓ Often nets MORE than traditional sale
The Fundamental Business Reality
Before examining specific costs, understanding the basic business model explains why cash offers can’t match retail prices.
Cash Buyers Are Business Operators, Not End Users
This distinction explains everything about pricing differences.
End-user buyers (traditional home purchasers):
- Buy homes to live in themselves
- Willing to pay retail prices for move-in ready condition
- Want minimal work and immediate occupancy
- Can’t or won’t handle extensive renovations
- Finance purchases with mortgages requiring properties to meet lender standards
Cash buyer investors (real estate business operators):
- Purchase properties as business inventory, not personal residences
- Must renovate and resell to generate business income
- Cover all renovation costs, holding expenses, and transaction fees
- Take on market risk during renovation and resale periods
- Need profit margins to compensate for capital risk and business operations
According to real estate investment industry standards, investors purchasing homes for renovation and resale must calculate offers that allow covering all costs while maintaining 10–15% profit margins. This isn’t greed — it’s basic business sustainability.
Why Investors Can’t Pay Retail
Simple math demonstrates why retail pricing doesn’t work for investor purchases.
Example: $500,000 retail value Long Island home
If investor pays retail ($500,000):
- Renovation costs: $50,000
- Holding costs (8 months): $24,000
- Sale transaction costs: $32,000
- Total costs: $106,000
- Resale price: $500,000
- Loss: -$106,000
Paying retail guarantees losses. To break even, investors must pay significantly below retail to cover costs. Since retail value represents what updated homes sell for, purchase prices must accommodate all documented expenses.
The Value Proposition for Sellers
Lower prices aren’t charity or exploitation — they’re fair exchange for specific benefits:
What you give up: 10–25% of retail value. What you receive: Speed (7–14 days vs. approximately 2–3 months for a traditional sale), near-certain closing once under contract, no repairs needed, no carrying costs during sale, no showing disruptions.
For many Long Island homeowners facing time constraints, property condition challenges, or a need for certainty, this exchange delivers better outcomes despite lower gross prices.
Breaking Down the Cash Offer Calculation
Transparency about how investors calculate offers helps evaluate whether specific offers are fair or exploitative.
The Standard Industry Formula
Legitimate cash buyers use this calculation methodology recognized throughout the real estate investment industry:
Cash Offer = ARV − Repair Costs − Holding Costs − Transaction Costs − Profit Margin
Where each component represents real, documentable expenses:
ARV (After Repair Value): What the home will sell for in updated, move-in ready condition based on comparable sales of renovated properties in your neighborhood.
Repair Costs: Contractor-estimated expenses to bring the property to retail condition.
Holding Costs: Monthly mortgage, taxes, insurance, and utilities during renovation period (typically 4–8 months) and marketing period (typically 2–4 months).
Transaction Costs: Purchase closing costs, renovation permitting fees, financing costs, sale commission, sale closing costs.
Profit Margin: Compensation for capital risk, business operations, and market volatility (industry benchmark: 10–15% of ARV).
Understanding how cash buyers work reveals why this transparent methodology separates legitimate operators from predatory lowballers.
Real Long Island Example: Suffolk County Property
Let’s calculate a real offer for a Patchogue property.
Step 1: Determine ARV
- Research 5–8 comparable sales of updated homes in the neighborhood
- Recent sales: $485K, $495K, $505K, $492K, $488K
- Average: $493,000
- ARV: $495,000 (conservative)
Step 2: Calculate Repair Costs
- Kitchen renovation (cabinets, counters, appliances): $28,000
- Two bathroom updates: $14,000
- Flooring throughout: $12,000
- Interior paint (all rooms): $6,000
- Exterior repairs (siding, trim): $5,000
- HVAC service and repairs: $3,000
- Landscaping improvements: $2,000
- Permits and inspections: $1,500
- Total Repairs: $71,500
Next, Step 3: Calculate Holding Costs
- Mortgage payment: $2,800/month × 8 months = $22,400
- Property taxes: $950/month × 8 months = $7,600
- Insurance: $200/month × 8 months = $1,600
- Utilities during renovation: $300/month × 8 months = $2,400
- Lawn/snow maintenance: $200/month × 8 months = $1,600
- Total Holding Costs: $35,600
Step 4: Calculate Transaction Costs
Purchase transaction:
- Attorney fees: $2,500
- Title search and insurance: $2,000
- Inspection: $500
- Recording fees: $400
- Purchase costs: $5,400
Sale transaction:
- Listing agent commission (post-NAR settlement, typically 2–3%): approximately $14,850
- Buyer agent compensation (now separately negotiated; included here as illustrative combined figure): approximately $12,375
- Staging: $2,500
- Professional photos: $600
- Attorney fees: $2,500
- Transfer taxes: $3,500
- Sale costs: approximately $36,325
- Total Transaction Costs: $41,725
Advisory Note: Real estate commissions are now fully negotiable following the NAR settlement effective August 17, 2024. The figures above use an illustrative combined listing and buyer agent commission. Actual investor transaction costs will depend on current market commission norms. Sellers should verify prevailing commission structures with a licensed agent before using these figures in financial planning.
Step 5: Calculate Profit Margin
- 12% of ARV: $59,400
- Compensation for 8-month capital lock-up, market risk, renovation management, business operations
Final Calculation:
- $495,000 (ARV)
- −$71,500 (repairs)
- −$35,600 (holding)
- −$41,725 (transactions)
- −$59,400 (profit)
- = $286,775 maximum offer (rounded to $285,000 for negotiation room)
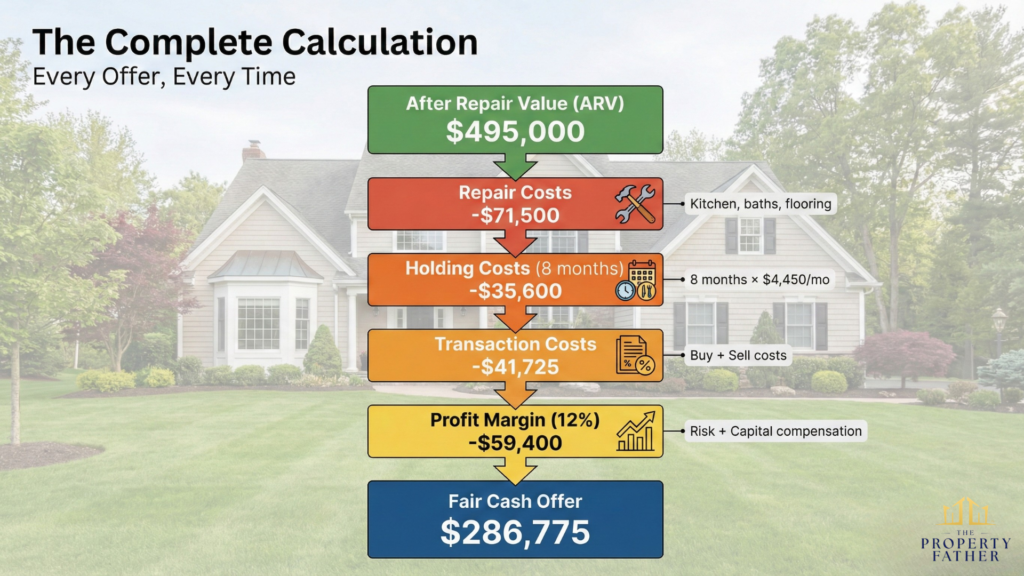
This represents a 42% discount from ARV, but it reflects $208,225 in documented costs plus a standard profit margin. The offer is mathematically fair given business economics, even though the percentage discount seems large.
Understanding how cash buyers work reveals this transparent methodology separates legitimate operators from predatory lowballers.
The Seven Cost Categories Explained
Each component represents real expenses investors must cover.
1. Property Condition and Repair Costs
The single largest factor affecting cash offers is needed repairs. Properties requiring work sell for less than turnkey homes regardless of who is buying — the difference is that investors will buy despite conditions that cause traditional buyers to walk away.
- Minor cosmetic updates ($10,000–$25,000): Paint, carpet, minor fixtures. Cash offer discount: 10–15% below retail.
- Moderate renovations ($25,000–$50,000): Kitchen/bathroom updates, flooring. Cash offer discount: 15–22% below retail.
- Major renovations ($50,000–$100,000): Multiple systems, structural work, full updates. Cash offer discount: 22–30% below retail.
- Extensive rehabilitation ($100,000+): Foundation, roof, complete gut renovation. Cash offer discount: 30–40%+ below retail.
Understanding whether to repair before selling helps evaluate whether cash offers make sense for your situation.
2. Holding and Carrying Costs
Real estate investors carry properties for extended periods, accumulating significant expenses:
Renovation period (4–8 months typical): Mortgage payments continue, property taxes accrue, insurance premiums are due, utilities remain active, property maintenance is required.
Marketing and sale period (2–4 months typical): All above costs continue, plus marketing expenses and showing preparation.
Nassau County example: $3,500–$5,000/month × 8–10 months = $28,000–$50,000 in holding costs alone. These aren’t optional expenses — every month of ownership costs money that must be factored into purchase prices.
3. Transaction Costs (Buying and Selling)
Investors pay transaction costs twice — once buying, once selling.
Purchase closing costs ($5,000–$10,000): Attorney fees (New York requires attorney representation in real estate closings), title search and insurance, inspection, recording and transfer fees, due diligence expenses.
Sale closing costs ($30,000–$40,000 on a $500K sale): Real estate commission (now fully negotiable post-NAR settlement; combined listing and buyer agent compensation varies), staging and professional marketing ($2,000–$4,000), attorney fees ($2,000–$3,000), transfer taxes and recording fees ($3,000–$5,000).
Total transaction costs: approximately $35,000–$50,000 on a typical Long Island property.
Advisory Note: Commission costs following the August 2024 NAR settlement are now fully negotiable and are no longer set through MLS cooperative compensation. Sellers should not assume a combined 5–6% commission applies automatically. Verify current commission arrangements directly with a licensed agent. Full details available at the NAR Settlement FAQ.
4. Profit Margin and Business Risk
The profit component often generates confusion, but represents a legitimate business requirement.
Why 10–15% profit is a standard industry benchmark:
- Compensates for 8–12 months of capital lock-up
- Covers unexpected repair overruns — according to a Clever Real Estate 2024 survey, 78% of renovation projects exceed their original budget
- Protects against market downturns during the holding period
- Funds business operations (staff, office, marketing, insurance)
- Provides return on equity comparable to other investments
A $60,000 profit on a $500,000 ARV property (12%) represents a modest return over an 8–12 month project cycle given the capital required and risk carried.
Investors charging 20–25% profit margins exceed the industry benchmark and may indicate pricing unfairness. Margins below 10% generally suggest unsustainable operations.
Advisory Note: The 10–15% profit margin figure is a widely cited industry benchmark, not a regulated standard. Actual margins vary by project complexity, market conditions, and operator. Consult primary data from ATTOM Data or similar investment research sources for current market figures.
5. Renovation Complexity and Timeline
Higher complexity means higher holding costs and greater market risk, both of which require lower purchase prices to maintain viable economics:
- Simple cosmetic work (3–4 months): Predictable costs and timeline.
- Moderate renovation (4–6 months): Multiple contractor specialties, permits, higher cost variability.
- Major rehabilitation (6–12 months): Structural work, foundation, systems. Significant cost and timeline risk justifying higher profit margin requirements.
6. Market Risk and Uncertainty
Investors assume significant market risk that homeowners selling immediately avoid. During an 8–12 month holding period: property values could decline, interest rates might increase reducing the buyer pool, economic conditions could weaken, or comparable sales could decrease. These risks aren’t theoretical — the 2008–2010 housing downturn left many investors holding properties worth less than purchase price plus renovation costs.
According to the FHFA House Price Index, annual home price changes have varied significantly by year and market. A meaningful decline during a holding period can eliminate profit margins entirely.
7. Financing and Capital Costs
Even investors who market themselves as “cash buyers” often use financing for some deals, creating additional costs:
Hard money or private lending (common for fix-and-flip investors):
- Interest rates in 2025: typically 9.5–14% annually for first-position loans, per current lender data
- Points at origination: 2–4% of loan amount
- On a $300,000 loan for 8 months: $20,000–$28,000 in financing costs
Business lines of credit:
- Interest rates vary by lender and borrower profile; verify current rates with lenders directly
- Ongoing costs during holding period
These financing expenses must be recovered through the purchase price discount, further explaining the gap between cash offers and retail values.
When Lower Cash Offers Make Sense
Despite lower gross prices, cash offers often deliver superior outcomes in specific situations.
Situation 1: Properties Needing Significant Repairs
For homes requiring $40,000+ in repairs, the comparison isn’t as simple as gross price difference.
Traditional sale approach: Invest $40,000+ upfront, wait 2–3 months for sale, risk deal fallthrough after repairs, pay commission, pay carrying costs.
Cash sale approach: No upfront investment, close in 7–14 days, near-certain closing, no commission, minimal carrying costs.
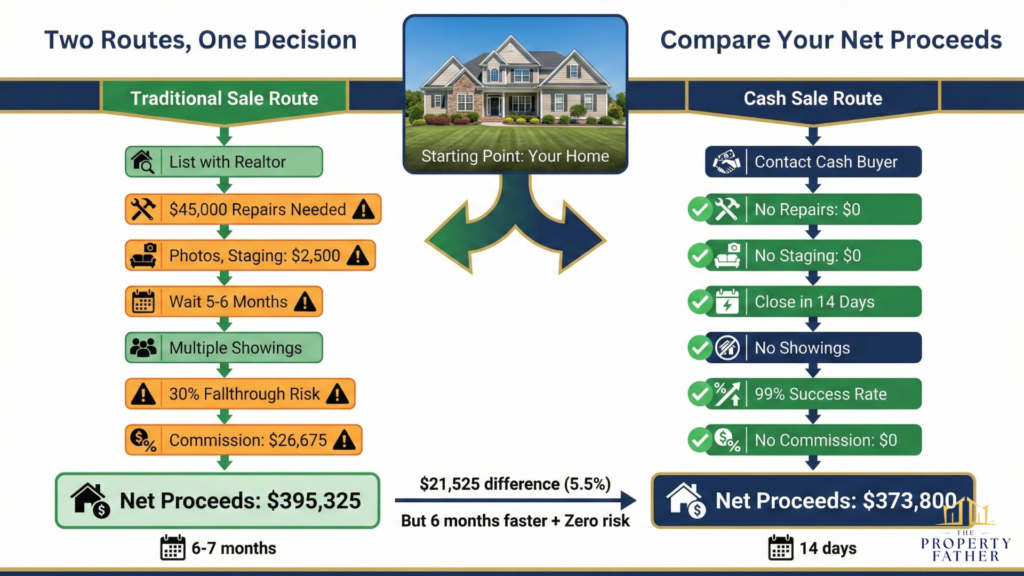
Real example: Nassau County home needing $45,000 repairs
Traditional sale:
- Estimated retail after repairs: $485,000
- Upfront repair investment: -$45,000
- Listing commission (post-settlement, illustrative): approximately -$14,550–$24,250 (range reflects negotiable commission structures)
- Carrying costs (approximately 3–4 months total): -$12,000–$16,000
- Net proceeds: approximately $400,000–$413,000 (range reflects commission variability)
- Timeline: approximately 3–4 months from start to close
Cash sale:
- Offer: $375,000
- No repairs: $0
- No commission: $0
- Carrying costs (2 weeks): -$1,200
- Net proceeds: $373,800
- Timeline: 7–14 days
Advisory Note: Net proceeds calculations are illustrative. Actual figures depend on negotiated commission structures under the post-NAR settlement environment, specific carrying costs, and closing expenses including NY transfer tax. Consult a licensed real estate attorney before making decisions based on these figures.
The gap in net proceeds is real but more modest than it appears in gross price comparisons — and the cash sale delivers months faster with near-zero deal risk and no $45,000 capital requirement upfront.
Situation 2: Time-Sensitive Circumstances
Traditional sale uncertainty has real costs. According to Redfin’s 2024–2025 MLS analysis, approximately 14–16% of pending home purchase contracts are canceled nationally. Nassau County specifically runs among the lowest in the country at approximately 4–5%.
Deal fallthrough consequences when they occur: 2–3 months wasted in a failed transaction; $5,000–$15,000 in additional carrying costs; psychological toll; lost opportunity to pursue other options; property may require price reductions after sitting on market.
Cash offers, once executed with a qualified buyer, carry a near-certain close probability because there is no financing contingency to fail.
Value of certainty calculation example (using Nassau County data):
For a $400,000 sale in Nassau County:
- Traditional route: approximately 5% chance of fallthrough (local rate)
- Expected cost of potential failure: $10,000–$20,000
- Cash offer: near-zero fallthrough risk after contract execution
- Certainty value: approximately $500–$1,000 (5% × cost of failure)
A cash offer $5,000–$10,000 below a traditional route but with guaranteed closing may provide better expected value after factoring in local fallthrough probability.
Advisory Note: Contract cancellation rates vary by market, season, and economic conditions. National figures are approximately 14–16%. Nassau County has historically run much lower (~4–5%). Consult current local market data for the most relevant figures.
Situation 4: Maximizing Actual Net Proceeds
When all costs are calculated correctly, lower cash offers often net more. Understanding the true cost of selling with a realtor reveals that net proceeds frequently favor cash sales for properties needing work, despite lower gross prices.
How to Evaluate Whether Lower Makes Sense for YOU
Step 1: Calculate Your Property’s Condition-Adjusted Value
Don’t compare cash offers to ideal retail — compare to realistic as-is value:
- Your home’s retail value: $XXX,XXX (if updated and in perfect condition)
- Needed repairs: $XX,XXX (get actual contractor quotes)
- Condition-adjusted value: Retail minus Repairs = $XXX,XXX
This represents what traditional buyers would realistically pay given current condition.
Step 2: Calculate True Traditional Sale Net Proceeds
Be realistic about all costs:
- Condition-adjusted retail value: $XXX,XXX
- Minus listing agent commission (now negotiable; confirm current rate): -$XX,XXX
- Minus buyer agent compensation (now negotiated separately; may or may not be seller-paid): –X,XXXto−XX,XXX
- Minus remaining repairs buyers demand: -$X,XXX
- Minus carrying costs (months × monthly cost): -$XX,XXX
- Minus staging and marketing: -$X,XXX
- Minus inspection credits: -$X,XXX
- Traditional net proceeds: $XXX,XXX
Advisory Note: Commission structure changed materially under the August 2024 NAR settlement. Do not assume a combined 5–6% applies. Verify current listing and buyer agent compensation norms with a licensed Long Island real estate agent before running this calculation.
Step 3: Calculate Cash Sale Net Proceeds
- Cash offer amount: $XXX,XXX
- Minus minimal closing costs (attorney, title, transfer tax): -$X,XXX
- Minus short carrying (1–2 weeks): -$XXX
- Cash net proceeds: $XXX,XXX
Step 4: Compare and Evaluate
Net proceeds difference, timeline difference, deal certainty difference, and stress difference — weigh all four, not just the price gap.
Step 5: Quantify Intangible Values
Assign dollar values to non-financial factors: your time, certainty of closing, speed of resolution, avoidance of showing-related disruption. Add these to the cash offer net for a complete comparison.
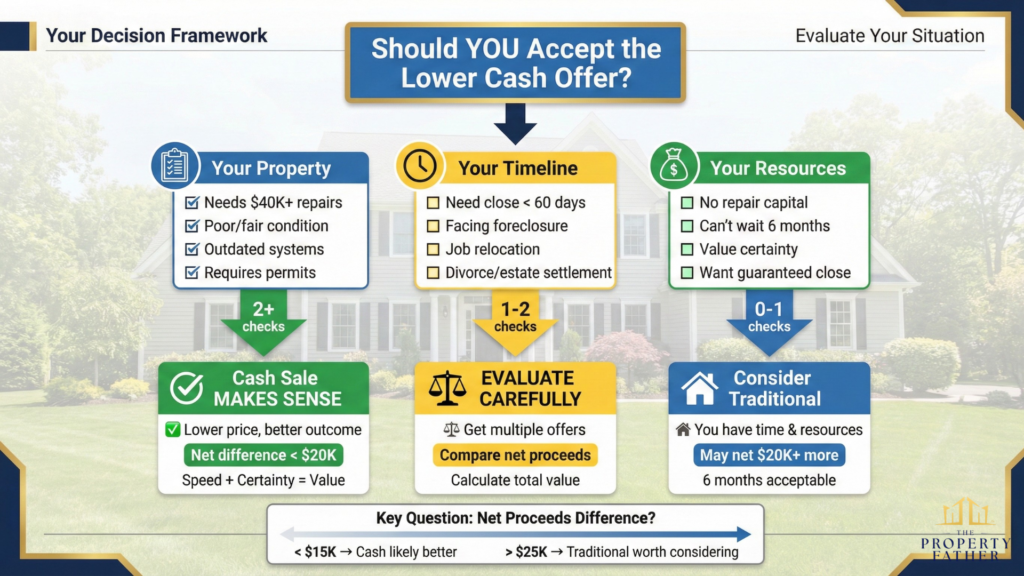
Decision Framework
Choose traditional sale if: Net proceeds exceed cash by $20,000+; you have 2–4 months available; you can fund upfront repairs; your property is in excellent condition; the market strongly favors sellers.
Choose cash sale if: Net proceeds are within $15,000 of traditional; you need to close within 60 days; you lack capital for major repairs; your property needs significant work; you’re in a time-sensitive situation.
Common Misconceptions About Cash Offer Pricing
These myths prevent accurate evaluation:
Myth 1: “Cash Offers Are Always Lowballs”
Legitimate cash offers reflect documented costs and standard profit margins. Lowball offers lack supporting calculations and fall well below multiple competing bids. Verify calculations and get multiple offers rather than assuming all cash offers are unfair.
Myth 2: “I’m Being Cheated Out of $100,000”
That $100,000 difference typically includes repairs you’d need to fund, commission you’d pay, carrying costs, and other expenses. The actual difference in net proceeds is often $5,000–$20,000 — significant, but context-dependent.
Myth 3: “Investors Make Too Much Money”
Standard 10–15% profit margins provide modest returns given capital requirements, timeline, and risk. A $60,000 profit on an 8-month project represents a reasonable business return for an operator with $300,000+ capital at risk.
Myth 4: “I Should Just List Traditionally”
Maybe — but only if your property is in good condition, you have time and capital for repairs, and you’re comfortable with the 2–4 month timeline and the reality that a percentage of contracts do fall through. For properties needing work or sellers with time constraints, traditional listing might net less after all costs despite higher gross prices.
Myth 5: “All Discount Percentages Are Equal”
A 20% discount on a turnkey home might indicate unfair pricing. A 20% discount on a property needing $60,000 in repairs might be very fair. Condition and context matter far more than the percentage alone.
Learning how to identify cash home buyer scams protects you while allowing you to benefit from legitimate transactions.
Questions to Ask Cash Buyers About Their Offers
These questions reveal whether lower offers reflect fair economics or exploitation:
“Can you show me comparable sales you used for ARV?” Legitimate answer: Provides 5–8 comparable sales of similar updated properties. Red flag: Vague answer without specific properties or addresses.
“Can you provide repair cost estimates?” Legitimate answer: Detailed breakdown with contractor quotes or itemized estimates. Red flag: Inflated estimates or refusal to share methodology.
“What’s your profit margin percentage?” Legitimate answer: “10–15% of ARV, which is the industry benchmark.” Red flag: Refuses to disclose or cites 20%+ margins without explanation.
“How did you calculate holding costs?” Legitimate answer: Shows monthly expense breakdown multiplied by estimated timeline. Red flag: Can’t explain or provides vague answers.
“Will you honor this offer or reduce it later?” Legitimate answer: “This is our firm offer based on current condition and our inspection findings.” Red flag: “We’ll need to inspect before finalizing the price.”
Reviewing the full list of questions to ask a cash buyer protects you from both missing good opportunities and accepting unfair offers.unfair offers.
Ready to Sell Your Long Island Home?
Understanding why cash offers are lower reveals they reflect legitimate business costs—not arbitrary lowballing. The 10-25% discount from retail accommodates documented renovation expenses, holding costs, transaction fees, and modest profit margins necessary for sustainable operations.
More importantly, focusing solely on gross price without considering net proceeds, timeline, certainty, and your specific circumstances leads to poor decisions. Lower cash offers frequently deliver superior outcomes for properties needing repairs, sellers with time constraints, or situations where certainty matters more than maximum potential price.
The Property Father operates with complete transparency—explaining every component of our offers, showing comparable sales, providing renovation estimates, and encouraging you to verify our calculations. We want informed sellers making confident decisions, not confused homeowners signing documents they don’t understand.
Get a fair, no-obligation offer in 24 hours with complete calculation transparency. Compare to your alternatives and make the choice that truly serves your interests.
See our Long Island Home Selling Guide for a complete breakdown of your options.